Well, California's at it again -- going in a different direction than the rest of the country.
The Census Bureau recently released a new report showed that -- by at least one measure -- the nation's overall population density dropped by 6% between 2000 and 2010. But by this same measure, the population density of most California metro areas -- where almost 90% of Californians live -- is going up. And density's going up faster in the smaller counties. What gives?
Overall, the Census Bureau concluded, the population density of the United States increased by 9.7%. But that's a meaningless figure. Since our nation's geographical area is not increasing, every time population goes up population density will go up too. So the Census Bureau tried something different -- a technique it calls "population-weighted density". It's the average population density from across all Census tracts in a particular geography -- the nation, the state, the metro area, whatever. Some demography nerds are excited that the Census Bureau has finally adopted this approach. And, indeed, since every Census tract has about the same population (around 4,000 people), an average across all Census tracts ought to be pretty revealing.
Nationwide, the Census Bureau found that, by this measurement, density dropped 6.0% in all metropolitan and micropolitan areas combined, and 5.5% in all metro areas. (Micropolitan areas are very small population centers that function like metro areas. Both metropolitan and micropolitan areas are delineated by county boundaries, and the vast majority of them nationwide are one county.) Of the 377 metro areas in the nation, population density dropped in 232 of them -- more than 60%.
But not in California. In our world, using the population-weighted approach, the population density of 14 of state's 22 metro areas went up. And, as Figure 1 shows, density was more likely to go up in small metros than in larger ones.
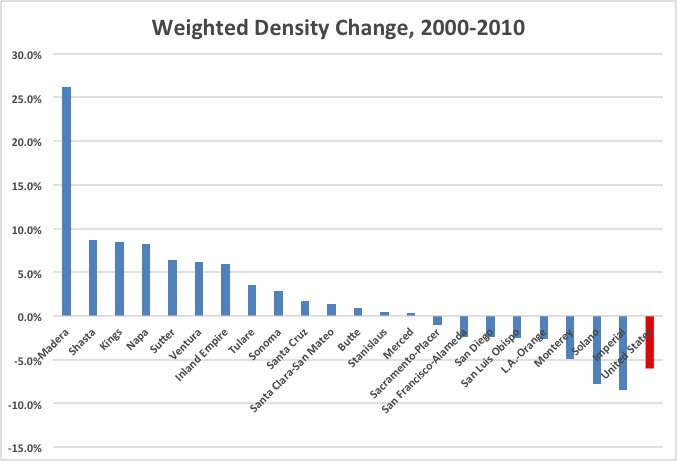
Itís not possible, based on the numbers the Census Bureau released, to calculate the overall density change for all metros in California. But the chart below gives you the idea. Population density increased the most -- by far -- in Madera County. Other places that saw population density go up were Shasta, Kings, Napa, Sutter, and the Inland Empire (Riverside and San Bernardino counties combined). Among those metros losing density were Sacramento, San Diego, San Luis Obispo, San Francisco, Los Angeles, and Monterey.
What's going on? Some of this makes sense and some of it is counter-intuitive. It makes sense that California metros are denser than the rest of the nation. But why would Madera, Kings, and Napa counties be densifying, while L.A. and San Francisco are not?
Remember what's being measured here: The average number of persons per square mile for all the census tracts in each metro area (most often, in each county). In the case of Madera County -- admittedly the outlier -- what this probably means is that new single-family subdivisions are being built at a suburban scale (that is, the same density as across the river in Fresno County), which is a very high density compared to the traditional, more rural development pattern in the county. In a suburban county such as Ventura -- my home county -- it's likely that several things are going on: more small-lot single-family subdivisions are being built, more previously passed-over sites are being built on, and more apartments are being built. (Remember last week's blog, which showed that between 2011 and 2013 -- admittedly a different time period -- most new construction in Ventura was multifamily.)
Fair enough. But why are densities going down in the big metros?
This is harder to answer. At first I thought it might be because household size is going down. After all, the big population growth in these metros in the '80s, '90s, and [00s was from immigrants and high fertility rates among immigrant families, and now the Latino baby boom is over. But that's not it: According to the Census Bureau, average household size in California actually went up between 2000 and 2010, both statewide and in most counties such as L.A.
My guess is that the aggregate number for these large metros is making smaller-scale trends -- that is, the dropping density in certain locations (most likely exurban areas) is more than making up for increasing or stable density in established locations. Imagine what LA-Orange might look like without the Antelope Valley, or San Francisco without Marin and eastern Contra Costa, or San Diego without East County.
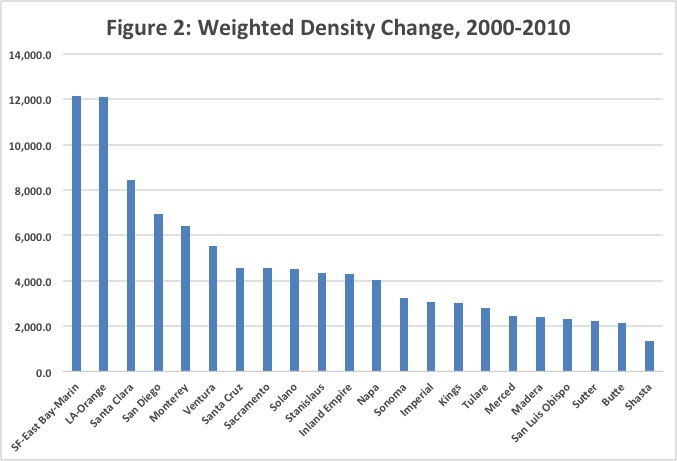
And anyway, as Figure 2 reminds us, these areas are already extremely dense. L.A. and San Francisco metros both have a weighted population density of about 12,000 persons per square mile. That's not nearly as much as New York, but itís way more than Chicago, Boston, or Washington. And it's six times as much as Madera.