Approximately one-third of new housing units constructed in California's metropolitan counties between 2000 and 2009 were built in infill locations, according to a new report from the Environmental Protection Agency.
The EPA Office of Sustainable Communities found that 386,000 infill units were built in the state's 19 metropolitan counties – 33.5% of the 1.15 million units built overall. This figure did not change between the boom years in the first half of the decade and the bust years in the second half.
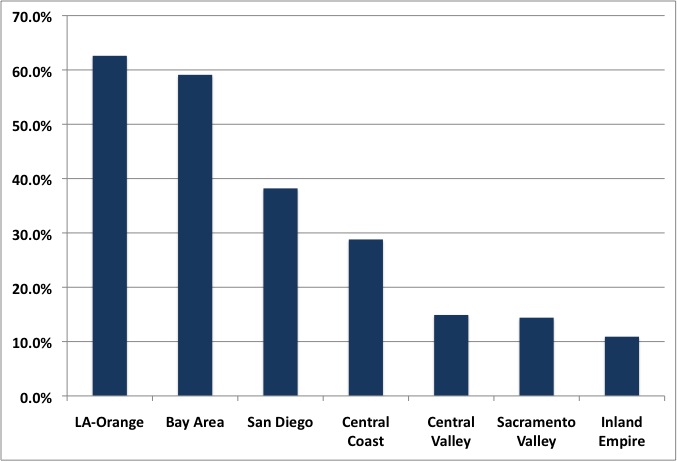
The Los Angeles-Orange County metro area (a separate metro area under the Census definition) led the state with 62% infill, followed by 59% in the Bay Area and 38% in San Diego. The highest percentage in the state was Santa Clara County (again, technically a separate metro according to the Census) with almost 80%.
The lowest figures were 11% in the Inland Empire and 14% in both the San Joaquin Valley and the Sacramento Valley, suggesting that these inland areas continue to serve as the greenfield "escape valves" for crowded coastal metros.
California's figure was significantly higher than the national total of 21% and about the same as the 32% total in the Northeast. Unlike in California, most metros saw an increase in infill construction during the bust.
The EPA defined infill housing as housing constructed in Census block groups that were mostly developed in 2000. The agency used American Community Survey data, land cover analysis, and comparative aerial images in doing the analysis.
% of New Housing In Infill Locations, 2000-2009